

Subject Specific Left Ventricular Modelling
Grand challenges lie in the subject-specific left ventricular modelling, as shown in Fig.1
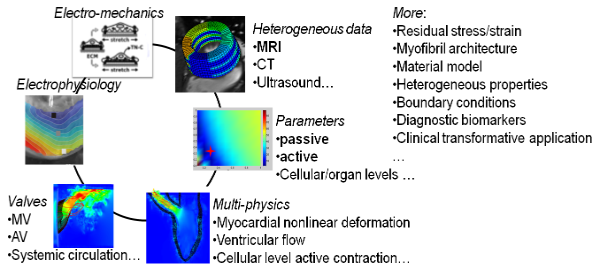
Fig. 1 Challengings related to subject specific LV modelling from in-vivo clinical data
To tackle those challengings, we are developing towards personalized left ventricular modellings as proposed in Fig.2
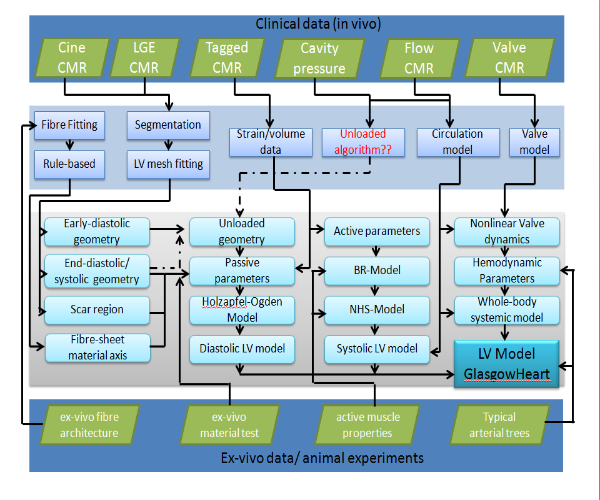
Fig.2 main components of subject-specific left ventricular modelling
Several major steps for constructing a subject specific model
- Step 1: Clinical in-viva data, shown in Fig.3
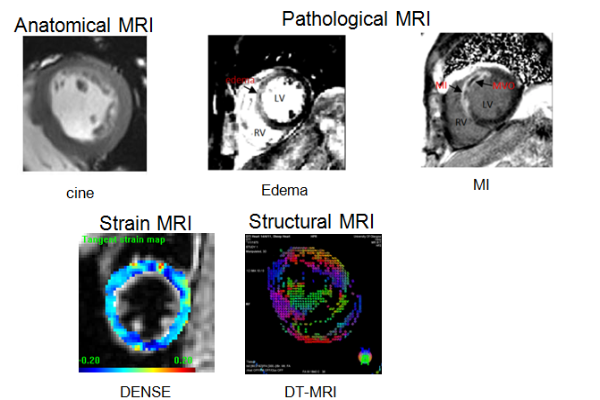
Fig.3 in-vivo CMR images
- Step 2: Image processing, involving segmentation, rigid registration, non-rigid registration, quantification ane so on
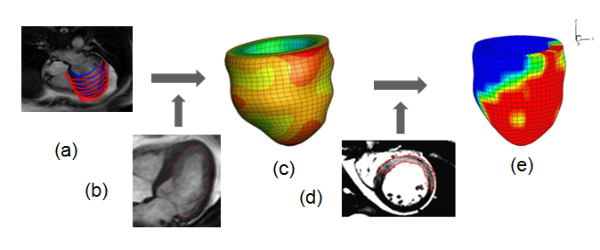
Fig.4 illustration of computational LV geometry reconstruction
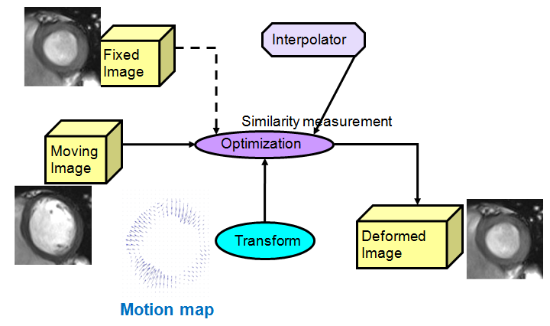
Fig.5 deformable image registration for strain recovery from cine MRI
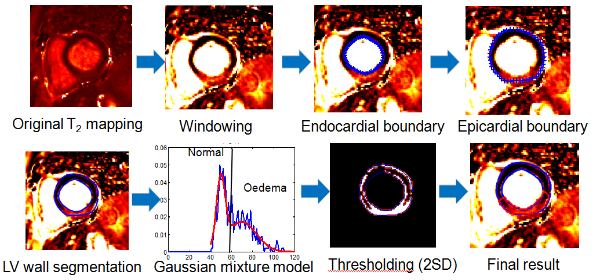
Fig.6 semi-automatic oedema/scar region quantification
- Step 3 Fluid-structure interaction (immersed boundary method, https://code.google.com/p/ibamr/)
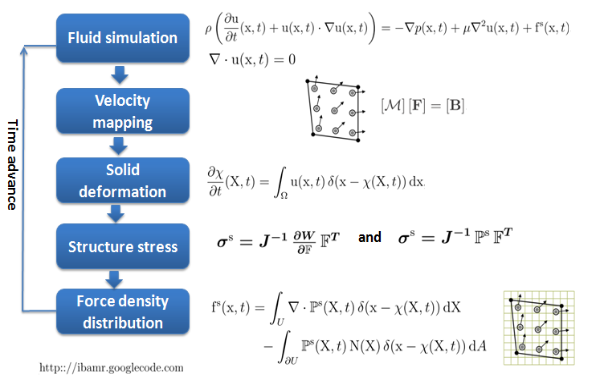
Fig.7 Brief introduction of immersed boundary method
Several ways to incorporate layered myofibers into LV model with mapping ex-vivo data base shown in Fig.8 or rule-based method. Currently in-vivo data is extremely hard to acquire.
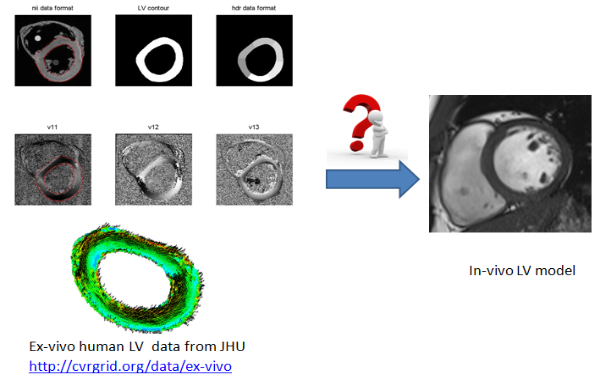
Fig.8 Myofiber architecture reconstruction from ex-vivo DT-MRI
- Material models (passive and active)
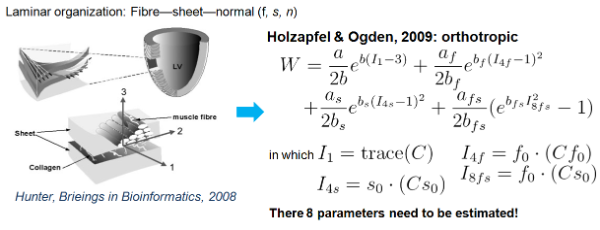
Fig.9 orthotropic passive myocaridal material model (structure-based)
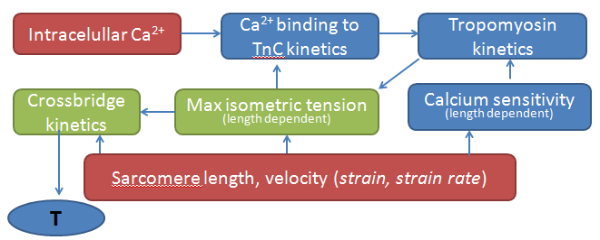
Fig. 10 active contraction model in the cellular level
- Material parameter identification (inverse problem)
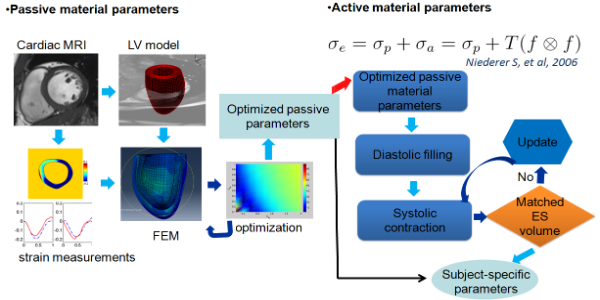
Fig.11 multi-step optimization procedure
- Step 4: Validation
Fig.12 shows the simulated LV endocardial surface is overlaped with a long axis CMR image from a healthy volunteer from end of diastole to end of systole
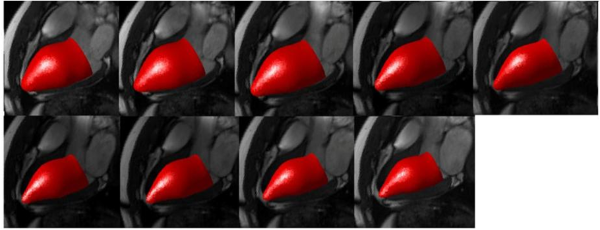
Fig.12 simulated LV endocardial surface (red)
Fig.13 is the strain comparison between simulated results (red) and mri measurements (blue) from end of diastole to end of systole
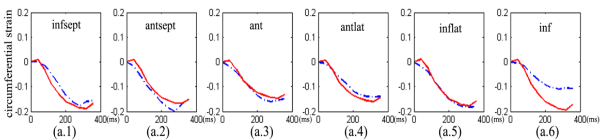
Fig.13 strain comparison
Videos and Presentations
LV model with inflow and outflow tracts
The corresponding LV endocaridal surface dynamics superimposed on the MR images
Presentation in the 7th World Congress of Biomechanics: